

This section presents the results of the physiotherapy movement’s recognition problem throughout the research. The proposed framework is evaluated through three datasets discussed in the previous section where each has a different level of complexity; however, the proposed framework can be implemented on all of them.
Significant pattern of spike train
Pattern recognition forms the basis of learning and action for all living things in nature as patterns are all around us, from human fingerprints, zebra crossing, etc. People grow up by recognizing various objects around us and learning to know, understand, and respond to identified things. Hence, this study develops a significant pattern for each of the exercises in order to differentiate each of the exercises by utilising the benefit of spike trains. The amount of information transmitted by a neuron, which is the spike trains, depends on assumptions about how the movement is read off. This study distinguished between exercise decoded according to the spike patterns. Spike patterns are as a “word” made up of a sequence of “letters”, considering each letter signifying the presence or absence of a spike, 1 or 0.
The information in the spike pattern was obtained by subdividing a window of frames from the cumulative frames or sequences—each of the datasets having different window sizes and is discussed thoroughly in each subchapter below. Overall, the movements definitely had a unique and significant pattern, which was very reliable for further analysis.
UI-PRMD dataset results
UI-PRMD dataset consists of segmented and unsegmented movements. To illustrate the patterns, this make use of the segmented movements in which each of the subjects performs ten episodes for each exercise. However, the sequences’ number for each exercise may vary from 100 to 150 frames. Hence, to standardize the number, the first 100 sequences are extracted per exercise. As illustrated in Fig. 13, some patterns are quite similar to each other. Note that all the patterns are correct movements. On 12-class alternatives. While UI-PRMD enables a 12-class (exercise correctness) framing, in cross-dataset design (including K3Da and Self-Collected without incorrect labels) and clinical interpretability motivated a two-stage approach. Future work could train a 12-class model on UI-PRMD and explore transfer of correctness cues via semi-/self-supervised adaptation to datasets lacking incorrect labels.
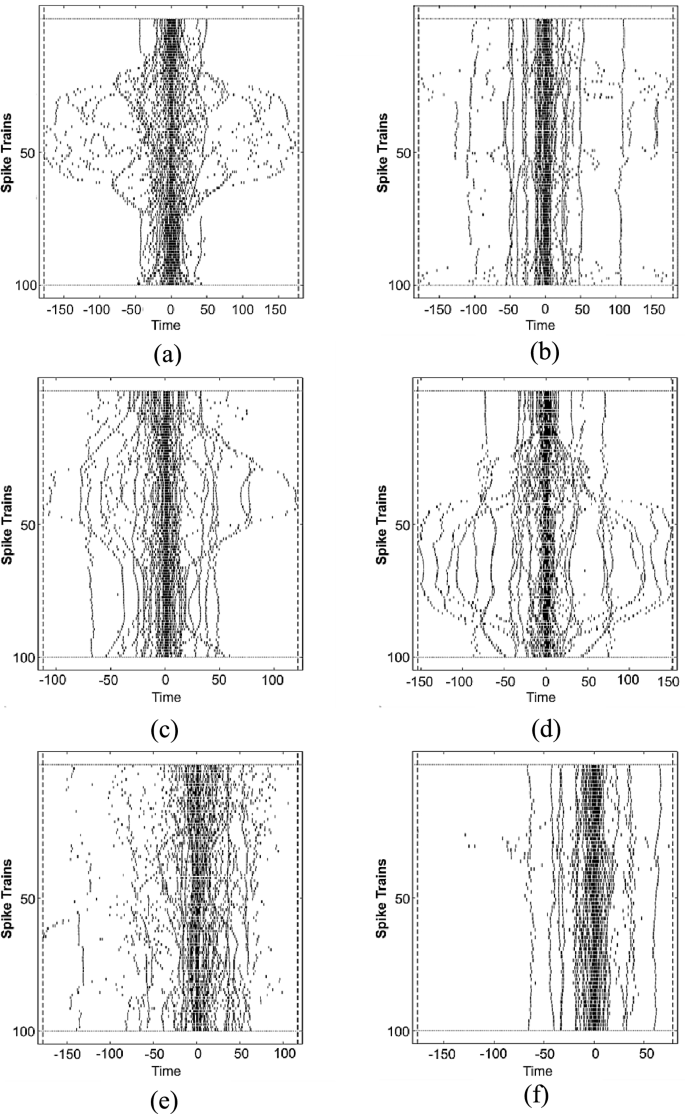
(a) Deep Squat; (b) Hurdle Step; (c) Inline Lunges; (d) Sit-to-Stand; (e) Standing Shoulder Extension; (f) Leg Raise. Phase-aligned bursts differentiate downward/upward phases; upper- vs lower-limb activation contrasts are visible. Time scale unified across panels.
For example, Patterns for Deep Squat (Fig. 13a), Inline Lunges (Fig.13c), and Sit to Stand (Fig. 13d) are look-alike due to the same direction of the exercises, which is up to down direction including the knee flexion and extension movements. While Hurdle Step (Fig.13b) is a reverse direction of them, which makes it differ from the mentioned figures. Shoulder Extension (Fig. 13e) and Leg Raise (Fig. 13f) can be said identical to each other, as there is a straight standing movement with no knee flexion and extension. Hence, the patterns for three of the exercises quite resembled each other. Although the patterns look the same, there are slightly different as spikes in the Shoulder Extension patterns entirely disperse than Leg Raise patterns. This is because the exercises involve different movements for each of them, such as Shoulder Extension implies an extended arm with straight elbow and wrists while Leg Raise, raising a straight leg with no upper limb movement.
K3Da dataset results
K3Da dataset is an RGB-D data containing clinically essential movements. Different from the UI-PRMD dataset, K3Da has a more abundant number of sequences within 300 to 600 frames where there is no break between the repetitions of a movement. Thus, this study standardizes the sequence number to 300 frames each except for the “Walking towards Kinect” movement, where it has smaller sequences than the others. As mentioned earlier, only five movements have been selected for this study.
Fig. 14 depicts five examples of significant patterns of the movements for a subject. The figure illustrates the fact that each of the movement carried a unique pattern for itself. From the figure, the movements can be clearly recognized. For example, Balance (Open Eyes) is depicted in Fig. 14 (a), which is had a similar pattern with Fig. 14(d) for One Leg Balanced (Open Eyes). Just that, for One Leg Balance movement, the pattern showed it is quite unstable for a person to stand with one leg, especially for someone with poor postural control as the person need to keep the Central of Mass (CoM) over the Base of Support (BoS).
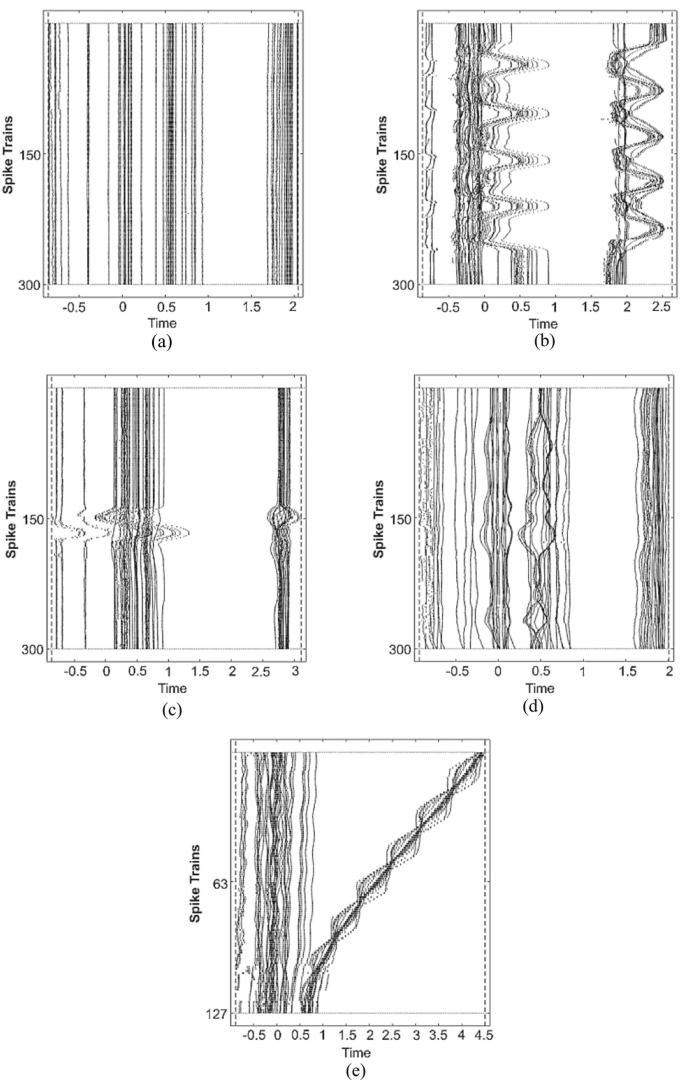
(a) Balance (Open Eyes); (b) Chair Stand; (c) Maximal Jump; (d) One-Leg Balance (Open Eyes); (e) Walk-towards-Kinect. Longer sequences (300–600 frames) show distinct temporal envelopes; repeated sit–stand cycles vs single explosive jump are visible in the raster patterns. Sample patterns of spike train in raster plot for K3Da dataset.
Next, the Chair Stand is illustrated in Fig. 14 (b), and the maximal jump is in Fig. 14 (c). For both patterns, Chair Stand showed repeatedly stand and sit movements, thus resulting in the pattern in Fig. 14 (b). However, for the Maximal Jump, the movement starts with a standing position and jumps with maximal energy, leading to a big wave on the straight-line pattern. Finally, walking towards Kinect is shown as in Fig. 14 (e), which is the shortest length of time for a movement. The spiking activities in all the movements make it worth producing a unique and significant pattern that can be visually categorized the patterns into the respective classes.
Self-collected dataset results
Among the three datasets, the self-collected dataset has the least number of sequences as only 25 to 30 sequences per movement were captured. Thus, this study standardizes the sequences to 25 frames each movement. The movements still showed a unique pattern for each of them. Although it is difficult to recognize the exercises visually, still, each of the patterns has its own way to portray the movement. Fig. 15 shows the patterns for five movements adopted in this dataset.
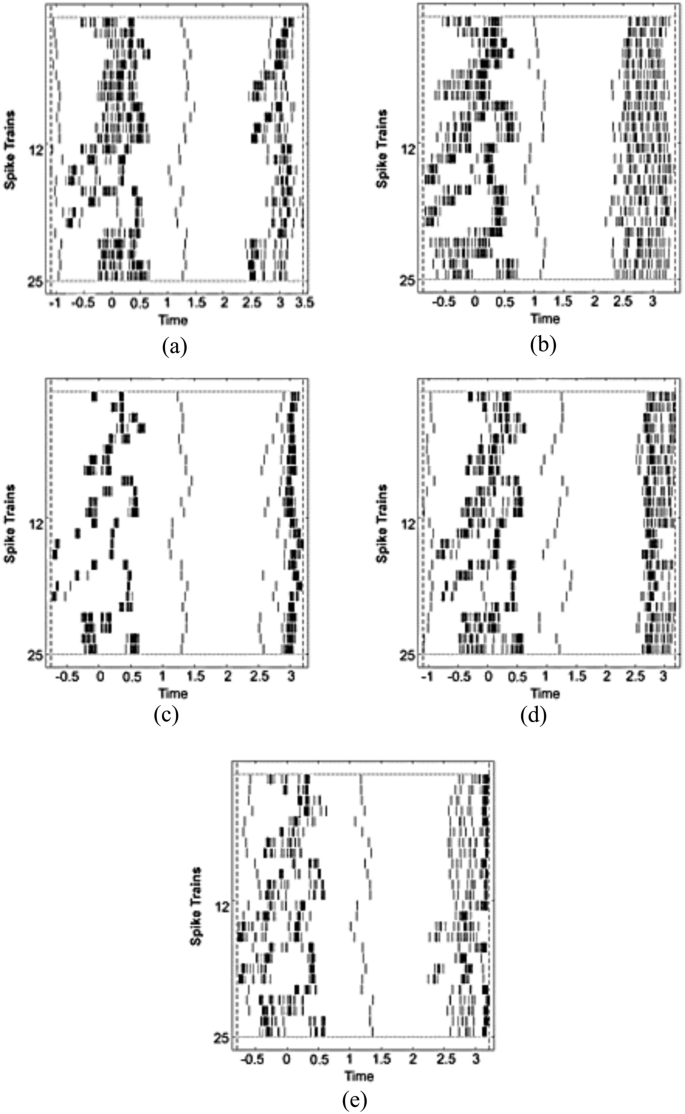
(a) Squat; (b) Lunges; (c) Heel Raise; (d) Sit-to-Stand; (e) Leg Raise. Despite short sequences (~25 frames/movement), each class exhibits a characteristic spike signature suitable for recognition.
Accurate movement by adjusting average firing rate curves
The tuning curve, which illustrates the connection between a neuron’s output and stimuli, is an essential part of neural information encoding. Three factors should be taken into consideration while optimising tuning curves to enable neurons to encode information efficiently: the definition of information efficiency, the computation of energy assumption, and the input probability distributions. The first two approaches were considered in this study, where the orientation of movement was considered the information efficiency and the average firing rate was considered the energy consumption.
The plot of the tuning curve of such neurons gives the average firing rate of the neurons as a function of the orientation of the oriented movement. This average typically represents both an average over time and an average of several trials of the identical movement. Other than the tuning curve characterising the average activity of a neuron’s response to a movement, this study is also interested in knowing more about the exact nature of the neuron’s response rate as follows:
-
1.
How does the rate of neuron firing during a movement performed differ over orientation?
-
2.
How regular or irregular is the spacing between individual spikes during a trial?
-
3.
How different are the trials of exercises from another?
This study proposed a movement correctness feature by calculating MPE and MAD from the tuning curve of average firing rates for a movement to answer the mentioned arguments. This is to validate the movements’ progression of a subject towards the ground-truth value, where the subtle differences between subjects’ performance and a ground-truth value are classified. A ground-truth value is chosen among the subjects with healthy and correct movement within the dataset. However, the ground truth value is only applicable to K3Da and the self-collected dataset only. For UI-PRMD, this study compares the incorrect movement of subjects to the correct movements, as the incorrect movements were provided in the dataset. Each of the subjects basically had a different number of frames while doing the exercises, but the firing spikes were still similar to each other.
UI-PRMD dataset results
UI-PRMD Dataset is a physical rehabilitation movement which comprises 100 instances of 10 rehabilitation movements where the primary goals of this dataset are to mathematically model the therapy movements and establish performance measures for clinically evaluating patients’ progression in performing prescribed rehabilitation exercises. Besides, the dataset also provides examples of the movements performed incorrectly for every subject. Incorrect movements include the wrong direction of movements, subjects’ faults, etc. The patterns of firing rates for each exercise are quite different from one another. Hence, this study compares the average firing rates of the incorrect movement to the corresponding correct movement for a subject.
Fig. 16 compares six correct and incorrect movements; the blue line marker is used for the correct movement, whereas the red line symbolises incorrect movements. This study takes into account five subjects for the evaluation of movement correctness; however, only graphs by a subject are displayed in this section as a sample. The graph shown shows exercises performed by a subject, who is a male graduate student from the University of Idaho. He is slightly overweight, with a body mass index of 26.6. As from the figures, the rate of neuron firing has slightly differed for each movement across orientations. The hurdle Step (Fig. 16(b)) and Standing Active Leg Raise (Fig. 16(f)) might have similar spike trends as physical exercises have the same gesture of movement. Also, the graph of the firing rate for the movements fluctuates vigorously due to the repetition of full-body movements. Thus, this shows that there are high regularity spikes firing between spaces for both correct and incorrect movements.

Average firing rates for a subject’s six right and wrong movements are compared.
Table 5. summarizes the results of the comparison for each movement, including the MPE, MAD, and movement correctness percentage, where it shows that the subject has the highest error on the Shoulder Extension movement and the lowest error on the Inline Lunges movement. This indicates that the subject might be having difficulties with the upper limbs instead of the lower limbs. Plus, from Fig. 13 (e), the tuning curve for the incorrect movement was very discouraging as it reversely inverted from the correct movement. Hence, the MAD value for shoulder extension is the lowest, indicating that the incorrect movement firing rates have deviated away from the correct movement.
K3Da dataset results
K3Da dataset consists of 13 movements adopted from SPPB, TUG, and additional tests of balanced output. As mentioned in the previous section, this study only employed five movements: Balance open eyes, chair stand, maximal jump, one leg balance open eyes, and walking towards Kinect. These clinically relevant assessments were led by the experts following standardized protocols. However, this dataset does not include incorrect movements. Hence, this study proposed to set a ground truth value among the fifty-four subjects in the dataset. A young, healthy, fit, and athletic subject has been chosen for the ground truth value due to the correct performance of the exercises by him. Five subjects have been chosen to be evaluated and assessed based on the likelihood of the individual sequences from a ground truth subject.
The analysis of five exercises, as illustrated in Fig. 17 reveals variations in movement performance across subjects. The balance open eyes exercise (Fig. 17a) showed minimal firing rate fluctuations, with slight variations due to individual differences and sensor positioning. Chair Stand movements (Fig. 17b) exhibited more significant firing rate changes, with subjects demonstrating different movement patterns and potential balance challenges around 60-degree orientation. The Maximal Jump exercise (Fig.17c) highlighted differences in balance, with the ground truth showing a smooth tuning curve, while Subject 1 displayed small fluctuations. One Leg Balance exercise (Fig. 17d) demonstrated frequent firing rate fluctuations, indicating balance difficulties, with most subjects experiencing sways. The Walking Towards Kinect exercise (Fig. 17e) showed decreased firing rates as subjects approached motion sensors. Table 6 provides comprehensive metrics including MPE, MAD, and movement correctness, quantitatively supporting the visual observations in Fig. 17 and revealing the nuanced performance differences across exercises and subjects.

Comparison of Average Firing Rate of five subjects based on ground truth for (a) Balanced Open Eyes; (b) Chair Stand; (c) Maximum Jump; (d) One Leg Standing Open Eyes; (e) Walking towards Kinect.
Self-collected dataset results
The self-collected dataset consists of five movements chosen from full-body exercises for muscle strengthening exercises to increase muscle strength and gain better balance, mobility, and ability in order to enjoy a healthy lifestyle. The five movements are squat, lunges, heel raise, sit to stand, and leg raise. These exercises are movements utilised by most patients, e.g., stroke patients or people who were aiming to control or reducing weight.
As per the previous dataset, this dataset also does not include incorrect movements. Hence, this study proposed to set a ground truth value among the ten subjects in the dataset. A young, healthy, fit, and athletic subject has been chosen for the ground truth value due to the correct performance of the exercises. Four subjects have been chosen to be evaluated and assessed based on the likelihood of the individual sequences from a ground truth subject. Most of the subjects are young and healthy; hence there is not much discrepancy in the likelihood. In this section, the graphs of five movements evaluated are discussed, and correctness metrics are tabulated, respectively.
The comparison of firing rates of five exercises (Squat, Lunges, Heel Raise, Sit to Stand, and Leg Raise) illustrated in Fig. 18 and detailed average correctness metrics in Table 7. reveals nuanced variations in subjects’ movement performance. The Squat exercise showed similar firing rate trends across subjects, with slight orientation differences attributed to varying frame rates. Lunges exercise demonstrated minimal spiking event variations between subjects and ground truth. Heel Raise exercise exhibited neuron spikes closely following ground-truth values, with an average percentage error of 22.65 but a high likelihood of matching ground truth. The Sit to Stand exercise revealed uniform neuron spiking, with Subject 4 showing the highest error (PE = 46.18). The Leg Raise exercise, performed while seated, showed the least aggressive neuron spike fluctuations, with Subject 1 closely following the ground truth (PE = 1.99) and Subject 3 experiencing significant rate drops. Table 7. quantitatively supports these observations, highlighting individual subject variations in MPE, Mean Absolute Deviation (MAD), and overall movement correctness across different exercises.

Comparison of Average Firing Rate of four subjects based on ground truth for (a) Squat; (b) Lunges; (c) Heel Raise; (d) Sit to Stand; (e) Leg Raise.
Recoginition rate
Recognition rate, also known as the accuracy of a DL classification algorithm, is one way to measure how often the algorithm classifies a data point correctly. The recognition rate is the number of correctly identified images out of all the images. Consider a classification algorithm decides whether to classify an image to its class; the algorithm is trained with several images and its label. Then, the efficiency of the algorithms to classify a new image to its class is evaluated.
To prepare it for training, the data sample is first divided into two disjoint groups for this study: training data and test data, respectively, using a standard ratio. This ensures that CNN has sufficient learning samples, which are acquired through the weight update procedure. The test samples are used to assess the generalization ability of the network. Supervised mode is used since each training sample has a label associated to it. The experime30nt makes use of Matrix Laboratory (MATLAB) software.
For the classification phase, this study trains using several CNN models and compare the classification method with five different number of layers: 25, 72, 144, 177, and 347 layers with respect to 6 epochs for all the classifiers. An adequate number of epochs is important and needs to be considerately chosen to avoid underfitting and overfitting. A number of epochs depends on the dataset trained; different datasets might have a different number of epochs. A lack number of epochs leads to underfitting, and too many epochs cause overfitting to take place. The last fully connected layer of each of the models has been modified to befit the dataset—the validation time increases as the number of layers gets bigger.
Fig. 19 depicts the overall physiotherapy movement recognition for all datasets, UI-PRMD, K3Da, and self-collected together with the five CNN models adopted in this study. Proposed CNN outperformed the other models with the highest recognition rate of 0.9944 for UI-PRMD, 0.9821 for K3Da, and 1.00 for self-collected data. Details on the results were being discussed in these sub-sections.

Overall physiotherapy performance recognition rate.
UI-PRMD dataset results
Table 8 tabulates the recognition of UI-PRMD datasets classified by several CNN architectures, and Fig. 20 illustrates the comparison of recognition among the five of them.

UI-PRMD Recognition Rate by CNN architectures.
As a result, the proposed CNN over performs as shwon Fig. 21 The proposed CNN classifier for 6-class exercise recognition on UI-PRMD achieved a RR of 0.9944, with a confusion matrix showing similar spike patterns in Deep Squat and Inline Lunges, with slight shifts to Sit to Stand.
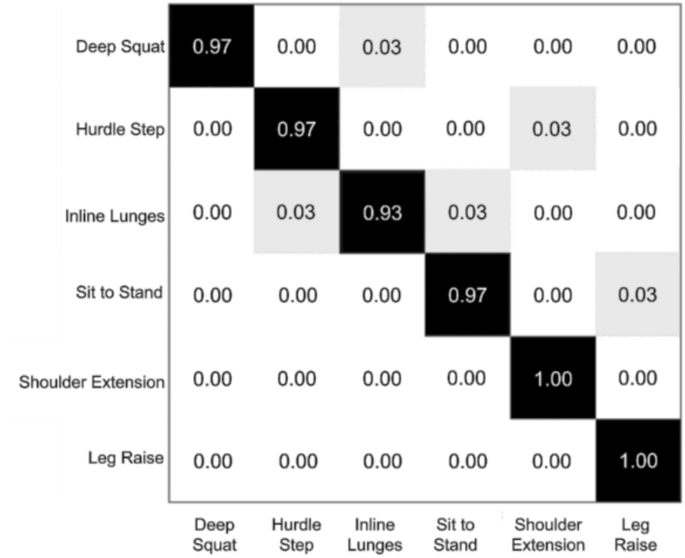
Confusion Matrix of recognition rate by proposed CNN for UI-PRMD dataset (RR = 0.9944).
In24, a DL framework has been demonstrated for assessing UI-PRMD datasets. There are three deep NN architectures being compared in work, which are CNNs, recurrent neural networks (RNNs), and hierarchical neural networks (HNNs). To the extend of my knowledge, this work can be said as the first framework that employs deep NNs for assessment of rehabilitation exercises. Three of the networks utilize skeletal joint coordinate data as the input; however, for HNN, the input is parted by five divisions: right arm, left arm, trunk, right leg, and left leg. Table 9. tabulates the comparison results for each exercise based on different approaches.
Despite the excellent performance, there are several limitations to this approach. A significant source of the restriction is due to the rehabilitation exercises collected that were performed by healthy subjects instead of patients in the rehab program. This study also falls short of addressing medical experts’ ground-level evaluation of the movement quality.
K3Da dataset results
Table 10. tabulates the recognition of K3Da datasets classified by several CNN architectures, and Fig. 22 illustrates the comparison of recognition among the five of them.

K3Da recognition rate by CNN architectures.
For K3Da, proposed CNN still overperforms other layers with 0.9821 accuracy. Fig. 23 explained the shifted recognition rate in a confusion matrix for the proposed CNN classifier. It achieved to classify all the classes correctly with 1.00 accuracy each of the exercises except for one leg balance exercise with 0.90 accuracy with a slight shift of 0.10 to the Jump exercise.
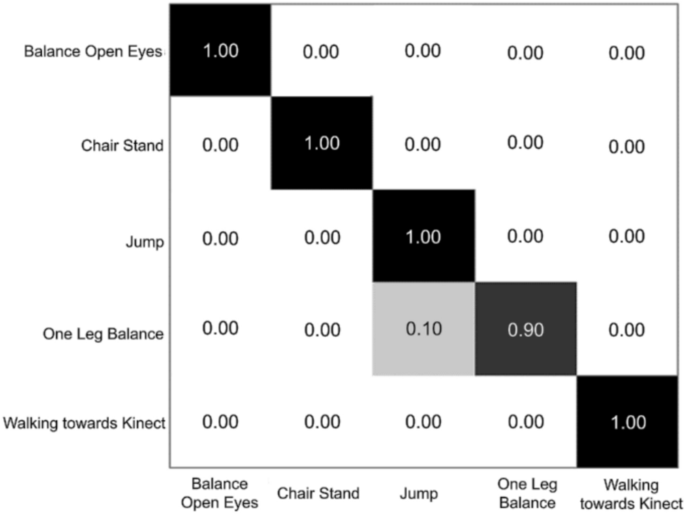
Matrix of recognition rate by proposed CNN for K3Da dataset (RR = 0.9821).
This is due to the similarity of both patterns, as compared in Fig. 24. For Jump movements, there is a wave on the spike patterns (as highlighted in the red box), where it is a natural pattern for One Leg Balance Exercise. Hence, a slightly shifted of one leg balance pattern to Jump are acceptable.

Jump and One Leg Balance pattern comparison.
In51, a bench marking identification rate of the K3Da datasets is developed to evaluate the ability to identify each test case. Daniel et al. adopted approached that are implemented in other engineering problems such as SVM, Random Forest (RF)69,70, Artificial Neural Networks (ANN)71,72,73, and Gaussian Restricted Boltzmann Machines (GRBM)74,75,76 with additional 10-fold cross-validation on each method for the preliminary evaluation. These works remove irrelevant information, resulting in a minimal training set. To generate a more representative result, the study randomly selecting a 40/60 training and testing set relying on the selection of k parameter for k-means. While for77, propose a hybrid of CNN for classification and implementing K-Mean Clustering to convert a time-series into a set representative pose. Table 11. summarised the results of both works discussed in this section and compared to the proposed CNN. Note that not all movements adopted in the study being evaluated in the compared work. Hence, the comparison only for the movements adopted in the proposed framework and the compared works as well.
Out of three movements compared, proposed CNN achieved a significant accuracy, and the obtained values are acceptable; thus, this study demonstrated that spike train features with DL approaches are able to outperform traditional methods. These results are encouraging and promising for further works.
Self-collected dataset results
Table 12. tabulates the recognition of K3Da datasets classified by several CNN architectures, and Fig. 25 illustrates the comparison of recognition among the five of them.

Self-collected recognition rate by CNN architectures.
From the results compared, it is clearly stated that proposed CNN outperforms others model by achieving 1.000 accuracy. Confusion matrix for proposed CNN has been drawn as in Fig. 26.
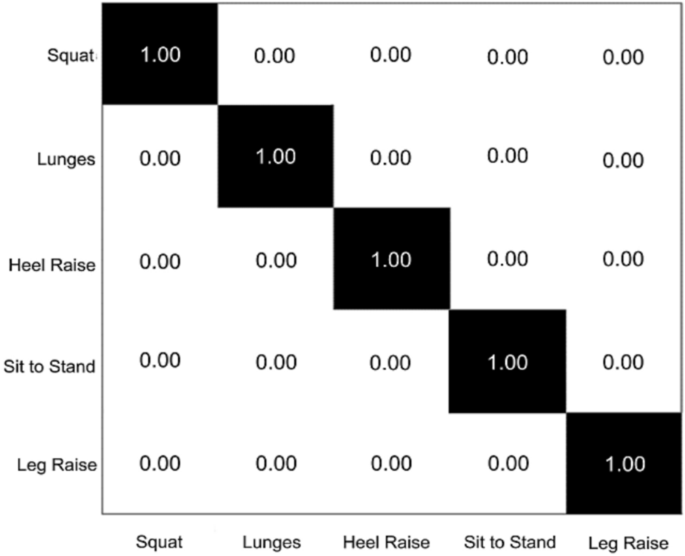
Confusion matrix of recognition rate by proposed CNN for self-collected datasets (RR = 1.000).
Since the self-collected datasets is primary data, there is no previous work on this datasets. However, this study intends to classify and compare the performance with several traditional machine learning. The data were split to 70:30 ratio of training and test, respectively. The results of the performance as tabulated in Table 13. From the results, proposed framework, again, outperform other algorithms, plus this also proves that spike train features were fitted to be classified on various classifier with the favorable recognition rates.
Physiotherapy assessment validation
There is a demand for tools and equipment to support home-based rehabilitation, also a new improvement in rehab centres, to reduce the burden for both patients and experts, such as robotic assistive devices, exoskeletons, haptic devices, and virtual gaming environments. Along with the rising motion capture sensors such as Microsoft Kinect, various Kinect-based rehabilitation assessments were developed, such as KiReS (Kinect Rehabilitation System) and VERA (Virtual Exercise Rehabilitation Assistant). Hence, the study also focused on physiotherapy assessment, where this study makes use of Kinect skeletal joint data from three datasets, where two of the datasets were public and a primary self-collected datasets.
As per the previous section, proposed CNN shows promising results in recognizing three datasets that adopted in this study as proposed CNN achieved the accuracy of 0.9944 for UI-PRMD, 0.9821 for K3Da, and 1.000 for the self-collected dataset. Hence, this study adopts proposed CNN as the primary DL architecture for physiotherapy assessment. This section produces correctness metrics for the subjects and exercises based on the training classifier. The details of the results and the validation of the assessment were explained details in each of the sub-section below.
UI-PRMD dataset results
Firstly, the proposed framework is validated by using UI-PRMD six incorrect movements of five selected subjects. The spike train patterns of incorrect movements are validated with the training classifier and the correctness metrics; accuracy, hereafter being known as correctness prediction, precision, recall, and F1-score, has been predicted.
Next, to validate the effectiveness and reliability of the proposed framework for physiotherapy assessment, this study compares the correctness metrics predicted by DL with the previously manually calculated MPE and MAD from tuning curves of average firing rates for the six movements. The validation of the physiotherapy assessment is tabulated in Table 14. and illustrated in Fig. 27, where the correctness metrics predicted by DL and the movement correctness from the firing calculation were plotted together.

Physiotherapy assessment validation for UI-PRMD.
As from Fig. 27, deep squat and inline lunges may have a slight discrepancy between the movement correctness and the correctness metrics predicted. However, the deviation is acceptable as the difference between the value of movement correctness and correctness prediction is under acceptable range which is less than 10% where 7.5% and 6.97% for deep squat and inline lunges respectively, while other values were grouping correctly and validate that the physiotherapy assessment for UI-PRMD is reliable and effective.
K3Da dataset results
Next, the spike train patterns of 5 subjects from K3Da, were validated with the training classifier and the correctness metrics; correctness prediction, precision, recall, and F1-score has been predicted. To validate the effectiveness and reliability of the proposed CNN of physiotherapy assessment, this study compares the correctness metrics predicted by DL with the previous manually calculated MPE and MAD from tuning curves of average firing rates for the five movements. The validation is tabulated in Table 15. and illustrated in Fig. 28, where the correctness metrics predicted by DL and the movement correctness from the firing calculation were plotted.

Physiotherapy assessment validation for K3Da.
As from Fig. 28, Balance open eyes and maximal jump may have a slight discrepancy between the predicted movement correctness and the correctness metrics. However, the deviation is acceptable, while other values were grouped correctly and validated that the physiotherapy assessment framework for K3Da is robust and trustable.
Self-collected dataset results
Lastly, the proposed physiotherapy assessment framework was validated using a self-collected dataset for five movements of four subjects. As per previous datasets, this study validates the effectiveness and reliability of the proposed framework of physiotherapy assessment by comparing the correctness metrics predicted with the previously manually calculated MPE and MAD from tuning curves of average firing rates for the five movements. The validation is tabulated in Table 16. and illustrated in Fig. 29, where the correctness metrics predicted by DL and the movement correctness from the firing calculation are plotted.

Validation of physiotherapy assessments for self-collected datasets.
From Fig. 29, all five movements values of predicted correctness metrics and calculated movement correctness were plotted. There is not much deviation of movement correctness from the correctness metrics. Hence, this study can conclude that the proposed framework is reliable and practical to assess physiotherapy movements in home-based or rehab centres.
Discussion
The results demonstrate that spike-train encoding combined with a tailored CNN architecture achieves superior recognition accuracy compared to conventional CNNs across multiple physiotherapy datasets. In particular, in approach achieved 0.9944 accuracy on UI-PRMD, 0.9821 on K3Da, and 1.000 on the self-collected dataset, substantially outperforming prior spike-train-based work 0.77 on UI-PRMD41,65. These findings highlight the effectiveness of bio-inspired temporal representations in HAR, especially in rehabilitation contexts where movement correctness is critical. Interpretation. Unlike skeleton-based graph models such as ST-GCNs, LSTMs, which model temporal dependencies explicitly, spike-train encoding emphasizes temporal sparsity and event timing, which appear particularly well-suited to capturing deviations in movement correctness. This bio-inspired representation therefore provides a complementary perspective to more conventional HAR models.
Limitations. Several limitations must be acknowledged. First, there are no obvious clinical claims because the datasets only include healthy volunteers with small sample sizes (10–54 people). Second, movement phenotypes specific to a condition were not included in the examination. Clinical validation studies are planned to address these limitations. First, only six of the ten UI-PRMD exercises were used, which restricts comparability with full-dataset studies even though it is therapeutically important. Second, representational richness may be limited by concentrating on joint position data rather than combining position and orientation modalities. Third, although though multiple-seed cross-validation was used, dataset sizes are still tiny when compared to large-scale HAR benchmarks, which could limit generalizability. Lastly, rather than being a 12-class exercise×correctness arrangement, The correctness assessment job was framed as a separate analysis in a future study, and future research should extend spike-train encoding to include additional tasks.
(i) incorporate multimodal skeletal features (positions + orientations);
(ii) evaluate a 12-class joint exercise–correctness classification pipeline;
(iii) test on larger-scale and more diverse rehabilitation datasets to validate generalization.
(iv) explore integration with transformer or graph-based architectures for hybrid modeling.
(v) investigate real-time implementations in home-based rehabilitation systems.
Taken together, the findings suggest that spike-train encoding provides a promising new avenue for rehabilitation movement recognition, with the potential to complement existing skeleton-based HAR methods and enhance clinical feedback systems.
link