

This section delineates the proposed architecture of a home-based upper limb rehabilitation system leveraging TinyML, along with the corresponding design and implementation process. Figure 1 presents a representation of the proposed system.

Schematic representation of the system.
Hardware design
Selecting the appropriate deployment device constitutes a pivotal factor influencing the overall design of the TinyML system. The principal characteristics to consider include cost, speed, power consumption, memory size, and product dimensions. Warden and Situnayake53 recommended three representative microcontrollers that support the TinyML framework, as illustrated in Table 2, and a detailed examination of these three microcontrollers was conducted. Among the three MCUs, the STMicroelectronics STM32F746G exhibits a marked superiority in performance; however, it presents critical drawbacks in terms of price, size, and power consumption. Although the SparkFun Edge (Apollo3 Blue) possesses certain advantages over the Arduino Nano 33 BLE Sense Rev2 in terms of price and power efficiency, the dimensions are of paramount importance considering the aim of this study to provide an unobtrusive home rehabilitation system. Hence, the Arduino Nano 33 BLE Sense Rev2 was selected as the microcontroller for this research. It employs the Nordic Semiconductor nRF52840 microcontroller as its primary processing unit, which is sufficiently rapid for the computational tasks of this study and relatively low in power consumption. The Arduino Nano 33 BLE Sense Rev2 also features an onboard 9-axis IMU system, comprising a 6-axis BMI270 and a 3-axis BMM150, offering adequate precision for measuring acceleration, rotation, and magnetic fields in 3D space. Importantly, within this study, the detection of upper limb rehabilitation movements relies solely on accelerometer data, which measure the vector of the gravitational field and the linear acceleration produced by forces acting on the sensor across each of its three mutually orthogonal sensor axes. ( The rationale for this selection is that accelerometers consume significantly less power than gyroscopes do (microwatts versus milliwatts)59, making them more suitable for prolonged continuous monitoring. Previous research has corroborated the feasibility of using accelerometer data to assess upper limb movements accurately60,61,62. In this study, we used the Arduino Nano 33 BLE Sense Rev2 chip paired with the Edge Impulse platform. This platform offers ready-made, open-source firmware designed for this specific development board, available on GitHub at edge impulse/firmware-arduino-nano33-ble-sense. By using this firmware, we streamlined our development process, avoiding the need to build firmware from scratch. This approach not only saved substantial development time but also allowed us to focus more on the fundamental aspects of our research. Figure 2 presents the details of the hardware system, where Fig. 2a represents the schematic diagram of the device wearing scenario. Figure 2b indicates the acceleration data collection of the wearable device. Figure 2c illustrates the circuit principles and structural layout of the wearable device.

Details of the Hardware System: (a) Wearable Device Wearing Scenario. (b) Device Acceleration Data Collection. (c) Wearable Device Circuit Principles and Structural Layout.
Software design
A mobile application (app) compatible with the hardware device was developed on the MIT App Inventor platform63 and was designed to facilitate more intuitive rehabilitation training for patients. In Fig. 3, a) illustrates the application in its initialization state, which prompts the user to establish a BLE connection with the corresponding hardware device; In Fig. 3, b) presents how the user is alerted when the app has not yet been connected to the hardware device; In Fig. 3, c) displays the BLE scanning status page, where users select the desired device for connection on the basis of the hardware device’s name; In Fig. 3, d) indicates successful device connection, allowing users to initiate rehabilitation training by pressing the “Start Exercise” button on the interface; and In Fig. 3,e) the app guides users through rehabilitation exercises via video. By tapping the button labelled “Effective Repetitions”, users can view the number of exercise repetitions marked as effective by the app. The app provides instructional videos for eight upper limb rehabilitation exercises (these exercises will be described in Section “Materials and methods”).

Illustrates the interface interactions of the mobile application: (a) The initialization interface. (b) Alerting the user that the app has not yet established a BLE connection with the hardware device. (c) Scanning for nearby BLE devices. (d) Successful BLE connection with the hardware device. (e) The interface after initiating the rehabilitation exercises.
The interactive logic between the app and the hardware device is depicted in Fig. 4, where the app functions as the central device (server) and the hardware device operates as the peripheral device (client). Upon the activation of the physical switch on the hardware device, the periphery initiates BLE initialization to ascertain the successful activation of the BLE module. Following successful activation, the periphery repetitively broadcasts BLE advertisements, and upon acquiring the advertisement data, the central device attempts to establish a connection with the node. After connection establishment, the central device interacts with the accessible information held by the node, a process predicated on services, each of which is further delineated into characteristics. In this study, two characteristics were instantiated for the BLE service of the hardware device: one facilitating read and write operations pertinent to action characteristics and another designated for notifications related to score characteristics. After the establishment of a BLE connection between the server and the client, information is included in the action characteristic, which conveys the current rehabilitation action ID to the client. Following the acquisition of acceleration data, the client executes local inference through the TinyML model. If the classification result aligns with the rehabilitation action ID inscribed by the server, it denotes the correctness of the patient’s rehabilitation action, prompting the operation of the LED ring and vibration motor module on the hardware device to furnish feedback to the patient. Moreover, the score characteristic designated for notifications apprises the central device of the count of effective actions.

System interaction logic diagram. The “score” represents the distance between a new data point and its nearest centroid, where “n” denotes the threshold.
Rehabilitation movements
The Brunnstrom approach constitutes a comprehensive therapeutic methodology tailored for the motor recovery of stroke patients64. The Brunnstrom theory divides the restoration of limb functionality into six distinct phases, within which patients acquire the ability to perform active exercises against gravity during phases 4 to 6, facilitating advanced rehabilitative training within a home environment. In accordance with the Brunnstrom approach to rehabilitation, eight upper limb rehabilitation exercises were identified for this study, as illustrated in Fig. 5. The selection of these exercises is attributed to their prevalence in hospital settings, their familiarity among stroke patients, and the comprehensive nature of the training content they offer, encompassing various aspects of motor impairments, including multijoint flexibility, muscle strength, and spasticity. Notably, exercises 1–5 are categorized as upper limb flexion movement training, whereas exercises 6–8 focus on upper limb extension movement training.
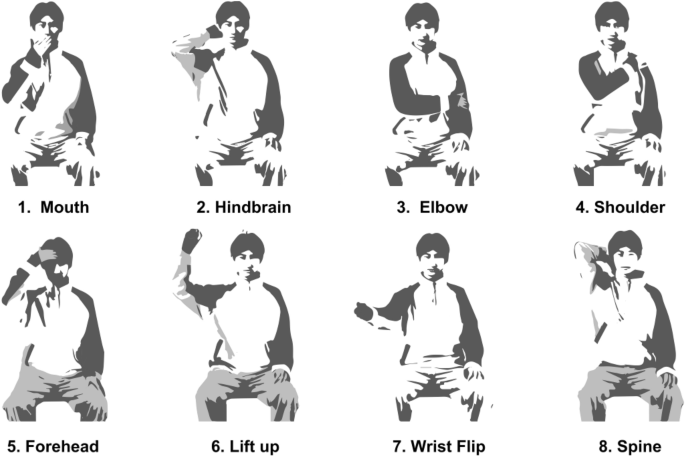
Schematic depiction of eight rehabilitation assessment exercises based on the Brunnstrom approach.
Data acquisition and analysis
This study focused on upper limb movements in poststroke rehabilitation training and included a total of ten physically healthy volunteers rather than actual stroke patients. The cohort comprised six males and four females, with an average weight of 59.2 ± 7.56 kg and height of 170 ± 7.32 cm; the mean age was 23.9 years (ranging from 22 to 26 years). Participants reporting any prior musculoskeletal disorders, pain, or discomfort were excluded. Additionally, anthropometric data (height, weight, sex, and age) were collected from the participants, all of whom signed a written informed consent.
The device utilized for data acquisition affixed to the participant’s dominant hand at the wrist via Velcro is illustrated in Fig. 6. Data collection and labelling were conducted via the data acquisition tools provided by the Edge Impulse platform65. Previous studies reported that a signal data frequency of 10 Hz is sufficient for detecting arm movements66. The default sampling rate of the Arduino Nano 33 BLE Rev2 chip is 119 Hz; however, we adjusted the sampling rate to 50 Hz (resulting in an actual effective sampling rate of 48.8 Hz) through downsampling, which meets the sampling precision required for this study.

Schematic of the data collection process: (a) The chip utilized for data acquisition. (b) The USB cable employed for data transmission. (c) Notebook computer.
As depicted in Fig. 6, participants are seated on a stool without armrests, maintaining an upright posture. The participants completed the eight rehabilitation exercises per the instructions displayed on a computer. Upon completion of each exercise, the arm is allowed to fall naturally to a vertical resting position before the exercise is repeated. This methodology is utilized to collect data on the fundamental movement units of the eight rehabilitation exercises during the upper limb motion process. Each posture was repeated 20 times for data collection, with each collection lasting 5 s, culminating in a total of 141 min and 5 s of raw accelerometer data, which were uploaded to the Edge Impulse platform in JSON format. The participants were afforded appropriate rest periods after the collection of each action. During the data acquisition process, participants were instructed to avoid contact with surrounding objects to prevent excessive acceleration and to refrain from making other significant body movements that could affect data collection. Notably, the data collection was conducted via a cable connected to a computer.
Each action constitutes a time series composed of acceleration signals along three orthogonal axes, XYZ. However, extracting motion patterns directly from raw acceleration data is exceedingly challenging because of high-frequency oscillations and noise. Therefore, prior to modelling, the raw data undergo preprocessing for feature extraction and selection. Window size and stride are critical hyperparameters in neural networks and other machine learning algorithms. To identify the optimal combination for our specific network, we conducted a series of tests varying these two parameters. Given that the discrete wavelet transform was employed for data preprocessing, the minimum window size required was 2560. Therefore, in our experiments, the smallest window size was set to 2800, considering the maximum data length of 5000, with the largest window size capped at 4000. This upper limit was chosen because increasing the window size further would not sustain an adequate number of data points to support the creation of multiple windows given the stride, thus impacting data utilization and the comprehensiveness of the analysis. As demonstrated in Table 3, the results indicate that the optimal validation accuracy was achieved with a window size of 3600 and a step size of 1800. Through overlapping and repetitive segmentation, each piece of raw acceleration data was divided into two windows, each 3600 in size with a stride of 1800, resulting in a total of 3064 training windows. Within the edge impulse platform, a robust digital signal processing (DSP) module is subsequently provided. Given the data typology of this study, we employed an input processing module based on spectral analysis for feature extraction. The spectral feature block encompasses two practical tools: the fast Fourier transform (FFT) and the discrete wavelet transform (DWT). We opted for DWT because it allows for signal decomposition on the basis of local changes in time and frequency, making it more suitable for analysing complex signals with transient or irregular waveforms, such as those emanating from accelerometer-based motion or vibration.
The raw acceleration data are decomposed into multiple approximations and detail levels through the application of the discrete wavelet transform (DWT), facilitating a nuanced analysis of the signal. Specifically, the features encompass acceleration axes (AccX, AccY, AccZ), levels (L0, L1, L2), and 14 statistical measures or transformations, yielding a total of 126 features. Following signal decomposition, relevant features are computed at each level, including time-domain features (zero cross, mean cross, median, mean, standard deviation, variance, and root mean square), frequency-domain features (entropy), and statistical domain features (5th percentile, 25th percentile, 75th percentile, 95th percentile, skewness, and kurtosis).
Implementation of the TinyML model
In this section, the neural network architecture and related work are described. To identify eight distinct upper limb rehabilitation actions exclusively through accelerometer data, we selected Edge Impulse, a web-based machine learning development platform, which furnished us with a comprehensive deep learning solution.
To identify the optimal training parameters for the model, this study conducted a series of experiments aimed at constructing an effective data structure for deep learning model inputs, ensuring the model’s ability to accurately learn and predict. Table 4 presents the optimal combination of hyperparameters determined through these experiments. The dataset used for training the model was randomly divided into two subsets: a training subset comprising 80% of the data and a testing subset consisting of the remaining 20%. The model was trained on the training subset and subsequently tested on the testing subset.
The Edge Impulse Studio offers a straightforward and effective module for classification learning. A multilayer perceptron (MLP) was constructed and trained utilizing the TensorFlow and Keras libraries for this classification task. Specifically, model training employs a sequential model architecture, providing a linear stack for the hidden layers. The deep neural network is engineered with an input layer that captures 126 distinct features and is meticulously designed to identify the unique attributes inherent to each category. To enhance the model’s robustness and prevent overfitting, it includes two hidden dense layers equipped with 40 and 20 neurons. A dropout layer, introduced with a dropout rate of 0.25, is strategically positioned between these dense layers to diminish the likelihood of overfitting, thereby ensuring a more generalized model performance.
For the choice of the activation function, the hidden layer uses the rectified linear unit (ReLU) activation function. Because ReLU can introduce nonlinearity while maintaining computational simplicity, it helps the model learn complex data representations and improves the model training speed, generalizability and robustness. Its function expression is shown in Eq. (1):
$$\text{ReLU}\left(x\right)=\text{max}\left(0,x\right)$$
(1)
where \(x\) is the input to the neuron, \(\text{max}\) represents taking the larger of the two numbers, and \(0\) is the cut-off point for \(\text{ReLU}\), which outputs \(x\) if x is positive and \(0\) if \(x\) is negative.
For the output layer, a Softmax activation function was used. Since this study involves the classification of eight different upper limb rehabilitation actions, the output layer is configured with eight neurons, and the output of each neuron represents the probability of belonging to the corresponding class. The Softmax function can convert the output into a probability distribution, and the Softmax output of the \({j}^{th}\) neuron is defined as Eq. (2) For a problem with K classes:
$$\text{Softmax}{\left(x\right)}_{j}=\frac{{e}^{{x}_{j}}}{{\sum }_{k}^{K}{e}^{{x}_{k}}}$$
(2)
where \({x}_{j}\) is the input of the \({j}^{th}\) output neuron, \({e}^{{x}_{j}}\) is the exponent of \({x}_{j}\) and the denominator is the sum of the exponent values of all the output neurons. The Softmax function ensures that the sum of all the output values is 1 and that each of the output values ranges from 0 to 1, which represents the probability of belonging to the corresponding category.
During training, the model is compiled via the Adam optimizer with a loss function of categorical_crossentropy, as shown in Eq. (3):
$$\text{Cross}-\text{Entropy Loss}=-{\sum }_{c=1}^{M}{y}_{o,{c}^{\text{log}({p}_{o,c})}}$$
(3)
where \(M\) is the number of categories, and for each category \(c\), \(y\) is a binary indicator (0 or 1) of whether category \(c\) is correctly categorized, and \({p}_{0,c}\) is the probability that the model predicts that observation \(o\) belongs to category \(c\). The function \(\text{log}({p}_{o,c})\) takes the natural logarithm of this predicted probability. Equation (3) The cross-entropy loss function, an extensively employed metric in classification endeavours to gauge the disparity between the forecasted probabilities and the empirical distribution of outcomes, is delineated. The term ‘Cross’ is indicative of this function’s deployment over both predicted and factual outcomes, whereas ‘entropy’ encapsulates a metric of indeterminacy or disarray prevalent within the prognostications. Overall, the ‘cross-entropy loss’ advantageously encapsulates the divergence of the model’s forecasts from the authentic labels, furnishing a formidable metric for optimization during the neural network model training regimen.
Model training was performed via the model.fit method with inputs from training and validation datasets, and the number of rounds, batch size, and callback functions were set. Figure 7 shows the final structure of the neural network after training. Among them, \(x\) in the input layer represents a 126 dimensional feature vector formed by extracting features from three—axis acceleration data. The first hidden layer \({a }^{[1]}\) contains 40 neurons, and the second hidden layer \({a }^{[2]}\) has 20 neurons. Through further feature refinement, the final output layer consists of—\({p}_{1}{p}_{8}\), corresponding to the 8 action classifications in the task of this paper. Each \(p\) represents the predicted probability of the corresponding category.

Final structure of the implemented and deployed neural network.
K-Means-based Anomaly Detection
Neural networks exhibit remarkable learning capabilities within the confines of their trained sample space, yet they present distinct limitations when encountering novel data beyond this predefined scope, such as new upper limb movements. This limitation stems from the inherent capacity of neural networks to recognize and comprehend only the data patterns they have been exposed to during their training regimens. Given that data significantly diverge from the training sample space, neural networks tend to erroneously categorize these novel inputs into one of the few known categories. To address this issue, we employed the K-means anomaly detection block, which is designed to discern data points that might otherwise be misconstrued within the conventional action classification framework.
K-means, as an unsupervised learning technique, furnishes an efficacious supplementary mechanism. It delves into the intrinsic structure of data, autonomously discerning latent clusters, thereby revealing unlabelled patterns within the dataset. The edge impulse platform has two adjustable parameters: the cluster count and axes. The cluster count denotes the segmentation of akin data points into a predetermined number of K clusters; the axes pertain to features generated by the preprocessing blocks, with the selected axes utilizing these features as input data for training.
Throughout the inference process, after extensive training, the optimal number of clusters was determined to be 32. The digital signal processing (DSP) module of the Edge Impulse Studio platform is capable of automatically extracting features from acceleration data and offers an option for computing feature importance. This process ensures the identification and utilization of the most critical features to enhance the model’s performance. Consequently, guided by the feature importance list generated by the Edge Impulse Studio platform, this study ultimately selected AccX L0-var, AccY L0-n95, AccY L0-rms, and AccZ L0-rms as the most significant features. For each cluster \({C}_{k}\), the center of mass \({\mu }_{k}\) is calculated as shown in Eq. (4):
$${\mu }_{k}=\frac{1}{\left|{C}_{k}\right|}{\sum }_{x\in {C}_{k}}x$$
(4)
where \(\left|{C}_{k}\right|\) is the number of data points in cluster \({C}_{k}\) and where \({C}_{k}\) is the number of data points in the cluster. The data points \({x}_{i}\) are assigned to the nearest center of mass \({\mu }_{k}\) to form the clusters, and this process can be expressed as:
$$assign\left({x}_{i}\right)={argmin}_{k}{\Vert {x}_{i}-{\mu }_{k}\Vert }^{2}$$
(5)
We calculate the distance between a new data point and its nearest center of mass and detect anomalies by setting a threshold as:
$$d\left({x}_{i},{\mu }_{k}\right)=\Vert {x}_{i}-{\mu }_{k}\Vert$$
(6)
If \(d\left({x}_{i},{\mu }_{k}\right)\) is greater than the threshold, then \({x}_{i}\) is an anomaly. The threshold in this study is set to 0. An anomaly score below 0 indicates that the data are within a cluster (no anomaly). Using the k-means anomaly detection module, this study computed the anomaly scores for new data points, which were then evaluated within the software. This program concurrently provides the classification outcomes from the neural network alongside the corresponding anomaly scores. The classification results are deemed valid when the anomaly score falls below a predetermined threshold; conversely, if the anomaly score exceeds this threshold, this indicates that the user’s performed action does not align with any of the eight predefined movements, thereby rendering the classification result invalid. This mechanism significantly enhances the robustness and accuracy of the overall classification system.
Model compression
Given the deployment of neural networks on MCUs with severely constrained computational resources, quantization has emerged as one of the most efficacious optimization strategies. Conventionally, weights and biases within the model are stored as 32-bit floating-point numbers to facilitate high-precision computations during the training phase; however, this incurs excessive resource consumption when executed on MCUs. The technique of quantization reduces the precision of these weights and biases, enabling their storage as 8-bit integers. Nonetheless, transitioning models from 32-bit floating-point representations to 8-bit integer representations has historically been challenging, necessitating profound knowledge of model architecture and the ranges of activation layers. Fortuitously, the edge impulse platform has introduced the edge optimized neural compiler (EON), which, compared with TensorFlow Lite for microcontrollers, enhances neural network execution speeds by approximately 25–55% and reduces flash storage by up to 35%, all while maintaining comparable accuracy levels. This innovation has significantly reduced engineering time and the costs associated with repeated iterative experiments for this study.
link