

Study selection
Figure 1 illustrates the process of selecting articles for this review. Initially, 964 articles were discovered from the database, including 289 articles discovered through Scopus, 287 articles discovered through PubMed, 183 articles discovered through Web of Science, 105 articles discovered through EBSCOhost, 100 articles discovered through Cochrane Library, and 14 articles discovered through Google Scholar. After manually removing duplicates through Endnote software, 669 articles were retained. Then, by screening the titles and abstracts of these records, it was found that 43 articles were non-English, 307 were not full texts, 123 were not journals, and 102 were not related to the research topic. Then, 94 articles were identified as eligible for full-text analysis. After conducting a full-text review, it was found that 94 articles needed to meet all the inclusion criteria for this system review. Finally, 21 publications fulfilled the inclusion criteria, 19 of which were used in the meta-analysis.

Flow chart of PRISMA article screening
Study quality assessment
The methodological quality of the included studies was assessed using the TESTEX scoring system, with the results presented in Table 1. TESTEX scores ranged from 8 to 12, with an average score of 9, indicating that the majority of studies demonstrated good methodological quality. However, all studies exhibited shortcomings in allocation concealment and implementing blinding, potentially increasing the risk of bias.
Additionally, a detailed risk of bias assessment was conducted using the ROB 2 tool, with the findings illustrated in Fig. 2. Figure 3 summarizes the overall risk of bias. Most studies demonstrated a low risk of bias in areas such as missing outcome data, outcome measurement, and selective reporting of results. However, certain studies displayed a degree of bias in the domains of randomisation processes and deviations from intended interventions. This highlights that, although the overall risk of bias was low, these weaknesses in study design and implementation warrant attention to enhance the credibility and reliability of future research.
Certainty of evidence
Table 2 shows the results of GRADE analysis. The GRADE evaluation results report a low level of certainty in the evidence.


Participant characteristics
The participant characteristics of the 19 studies included in this system review were reported in Table 3, as shown below. (1) Sample size: The 19 studies comprised a total of 2215 individuals, with sample sizes ranging from 20 to 92 [10, 19,20,21,22,23,24,25,26,27,28,29,30,31,32,33,34,35,36]. (2) Age: Participants who meet the criteria reported in studies are aged between 10 and 23 years old [10, 22,23,24,25,26,27,28,29,30,31,32,33,34,35,36,37,38,39]. (3) Training experience: Ten studies involve athletes [10, 23,24,25, 29, 30, 35,36,37], four studies involve cadets [22, 32, 34, 39], two studies involve healthy women [27, 38], two studies involve high school students [31, 32], one study involves middle school students [28], and one study focuses on firelighter recruits [33].
Intervention characteristics
Table 3 summarises the 19 intervention characteristics included in the study. (1) Intervention type: HIFT served as the main intervention strategy in all studies. One study specifically used HIFT intervention [33], while twelve studies used CrossFit training intervention [22, 23, 25, 27, 29, 30, 32, 34,35,36,37, 39]. three study combined CrossFit training with resistance training [24, 26, 38], and the other study carried out comparison tests between CrossFit AMRAP and traditional CrossFit [10]. One study used the CrossFit school challenge [31], and the other used the CrossFit Kids Programme [28]. (2) Intervention frequency: Among the 19 studies, eleven had an intervention frequency of 3 times per week [10, 22, 25,26,27,28,29,30, 33, 35, 38], four had an intervention frequency of 2 times per week [31, 32, 36, 39], two had an intervention frequency of 4 times per week [23, 24], and one had an intervention frequency of 1 times per week [34]. (3) Intervention length: Seven studies lasted for 8 weeks [10, 23, 25, 27, 30, 31, 35], three studies lasted for 12 weeks [24, 32, 37], the shortest study lasted for 5 weeks [39], one study lasted for 10 weeks [33], one study lasted for 16 weeks [34], one study lasted for 24 weeks [38], one study lasted for 5 months [36], 9 months were spent on two study [26, 28], one study lasted for 12 months [29], and the longest study lasted for three years [22].
Outcome
Effect of high-intensity functional training on strength of healthy individuals
Fourteen of the nineteen research articles examined the effect of HIFT on the strength healthy individuals [22,23,24,25,26, 28,29,30,31,32,33, 36, 38, 39]. This meta-analysis’s results show that HIFT significantly impacts the strength of healthy individuals (ES = 1.380; 95% CI = 0.770–1.990; p < 0.001; Egger test p = 0.053; N = 659; Fig. 4A). The overall heterogeneity of the effect is moderate (Q = 27.877; I² = 42.605%). In the meta-analysis process, the relative weight range for each study is 3.82–6.45%.
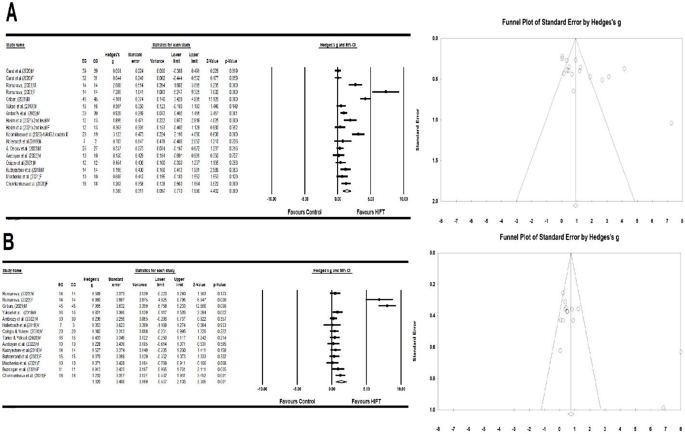
(A) Forest plot and funnel plot of the impact of HIFT on the strength of healthy individuals compared to the control group. (B). Forest plot and funnel plot of the impact of HIFT on the power of healthy individuals compared to the control group. The displayed values represent the effect size (Hedges’ g) of 95% confidence intervals (Cl). The size of the square shown in the figure represents the statistical weight
Effect of high-intensity functional training on power of healthy individuals
Thirteen discussed how HIFT affected healthy individuals’ power [10, 22, 25,26,27, 29, 30, 33, 35,36,37,38,39]. This meta-analysis’s results indicate that HIFT significantly impacts healthy individuals’ power (ES = 1.320; 95% CI = 0.537–2.103; p < 0.001; Egger test p = 0.051; N = 476; Fig. 4B). The overall heterogeneity of the effect is moderate (Q = 33.140; I² = 60.773%). In the meta-analysis process, the relative weight range for each study was 5.33–7.66%.
Effect of high-intensity functional training on speed of healthy individuals
Four discussed how HIFT affected healthy individuals’ speed [26, 29,30,31]. This meta-analysis’s results indicate that HIFT significantly affect healthy individuals’ speed (ES = 3.093; 95% CI = 1.432–4.754; p < 0.001; Egger test p = 0.050; N = 186; Fig. 5A). This meta-analysis’s results indicate that the overall heterogeneity of this effect is moderate (Q = 26.433; I² = 69.084%). In the meta-analysis process, the relative weight range for each study was 8.18–19.42%.
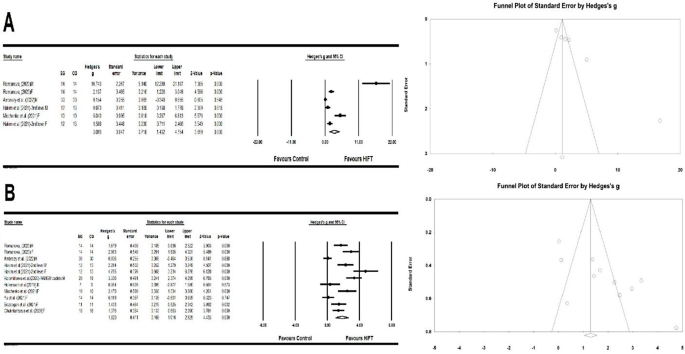
(A). Forest plot and funnel plot of the impact of HIFT on the speed of healthy individuals compared to the control group. (B). Forest plot and funnel plot of the impact of HIFT on the endurance of healthy individuals compared to the control group. The displayed values represent the effect size (Hedges’ g) of 95% confidence intervals (Cl). The size of the square shown in the figure represents the statistical weight
Effect of high-intensity functional training on endurance of healthy individuals
Nine discussed how HIFT affected healthy individuals’ endurance [26, 29,30,31,32,33,34, 37, 38]. This meta-analysis’s results show that HIFT significantly impacts the endurance of healthy individuals (ES = 1.820; 95% CI = 0.169–2.625; p < 0.001; Egger test p = 0.054; N = 321; Fig. 5B). The overall heterogeneity of this effect is low (Q = 11.007; I² = 9.150%). In the meta-analysis process, the relative weight range for each study was 7.64–10.09%.
Effect of high-intensity functional training on agility of healthy individuals
Seven discussed how HIFT affected healthy individuals’ agility [26,29–33,36,38,39). The results showed that HIFT significantly impacted agility in healthy individuals (ES = 2.086; 95% CI = 1.112–3.060; p < 0.001; Egger test p = 0.053; N = 319; Fig. 6A). The overall heterogeneity of this effect is moderate (Q = 26.418; I² = 62.147%). In the meta-analysis process, the relative weight range for each study was 5.66–10.13%.
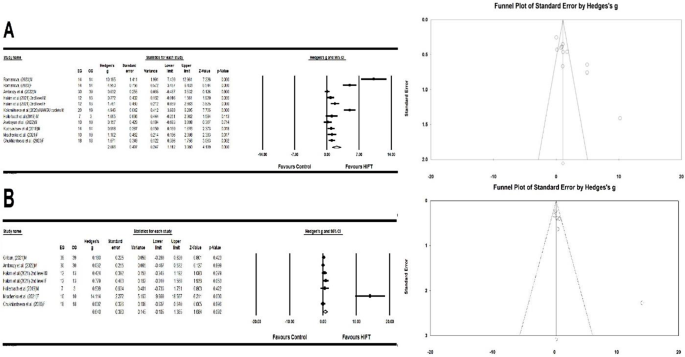
(A). Forest plot and funnel plot of the impact of HIFT on the agility of healthy individuals compared to the control group. (B). Forest plot and funnel plot of the impact of HIFT on the flexibility of healthy individuals compared to the control group. The displayed values represent the effect size (Hedges’ g) of 95% confidence intervals (Cl). The size of the square shown in the figure represents the statistical weight
Effect of high-intensity functional training on flexibility of healthy individuals
Six discussed how HIFT affected healthy individuals’ flexibility [22, 26, 30, 31, 33, 38]. This meta-analysis’s findings show that HIFT has no significant effect on the flexibility of healthy individuals (ES = 0.640; 95% CI = -0.105-1.385; p = 0.092; Egger test p = 0.057; N = 254; Fig. 6B). The overall heterogeneity of this effect is moderate (Q = 22.012; I² = 61.257%). In the meta-analysis process, the relative weight range for each study was 2.45–18.16%.
Effect of moderator variables
Table 3 shows the analysis results of mediating variables. The subgroups analysed in this study include intervention time (< 12 weeks and ≥ 12 weeks) and gender (male and female). For intervention length, studies with intervention time < 12 weeks showed moderate efficacy (ES = 0.727, 95% CI: 0.491–0.963, p < 0.001), and studies with intervention time ≥ 12 weeks also showed moderate efficacy (ES = 0.960, 95% CI: 0.740–1.179, p < 0.001). For gender, studies focusing on males (ES = 1.370, 95% CI: 0.947–1.793, p < 0.001) and studies focusing on females (ES = 1.941, 95% CI: 1.392–2.490, p < 0.001) both showed large efficacy. The Q statistic of subgroup analysis showed a significant difference in intervention length (p < 0.001). Further subgroup analysis showed no significant difference in Q-statistics between genders (P = 0.106).
link